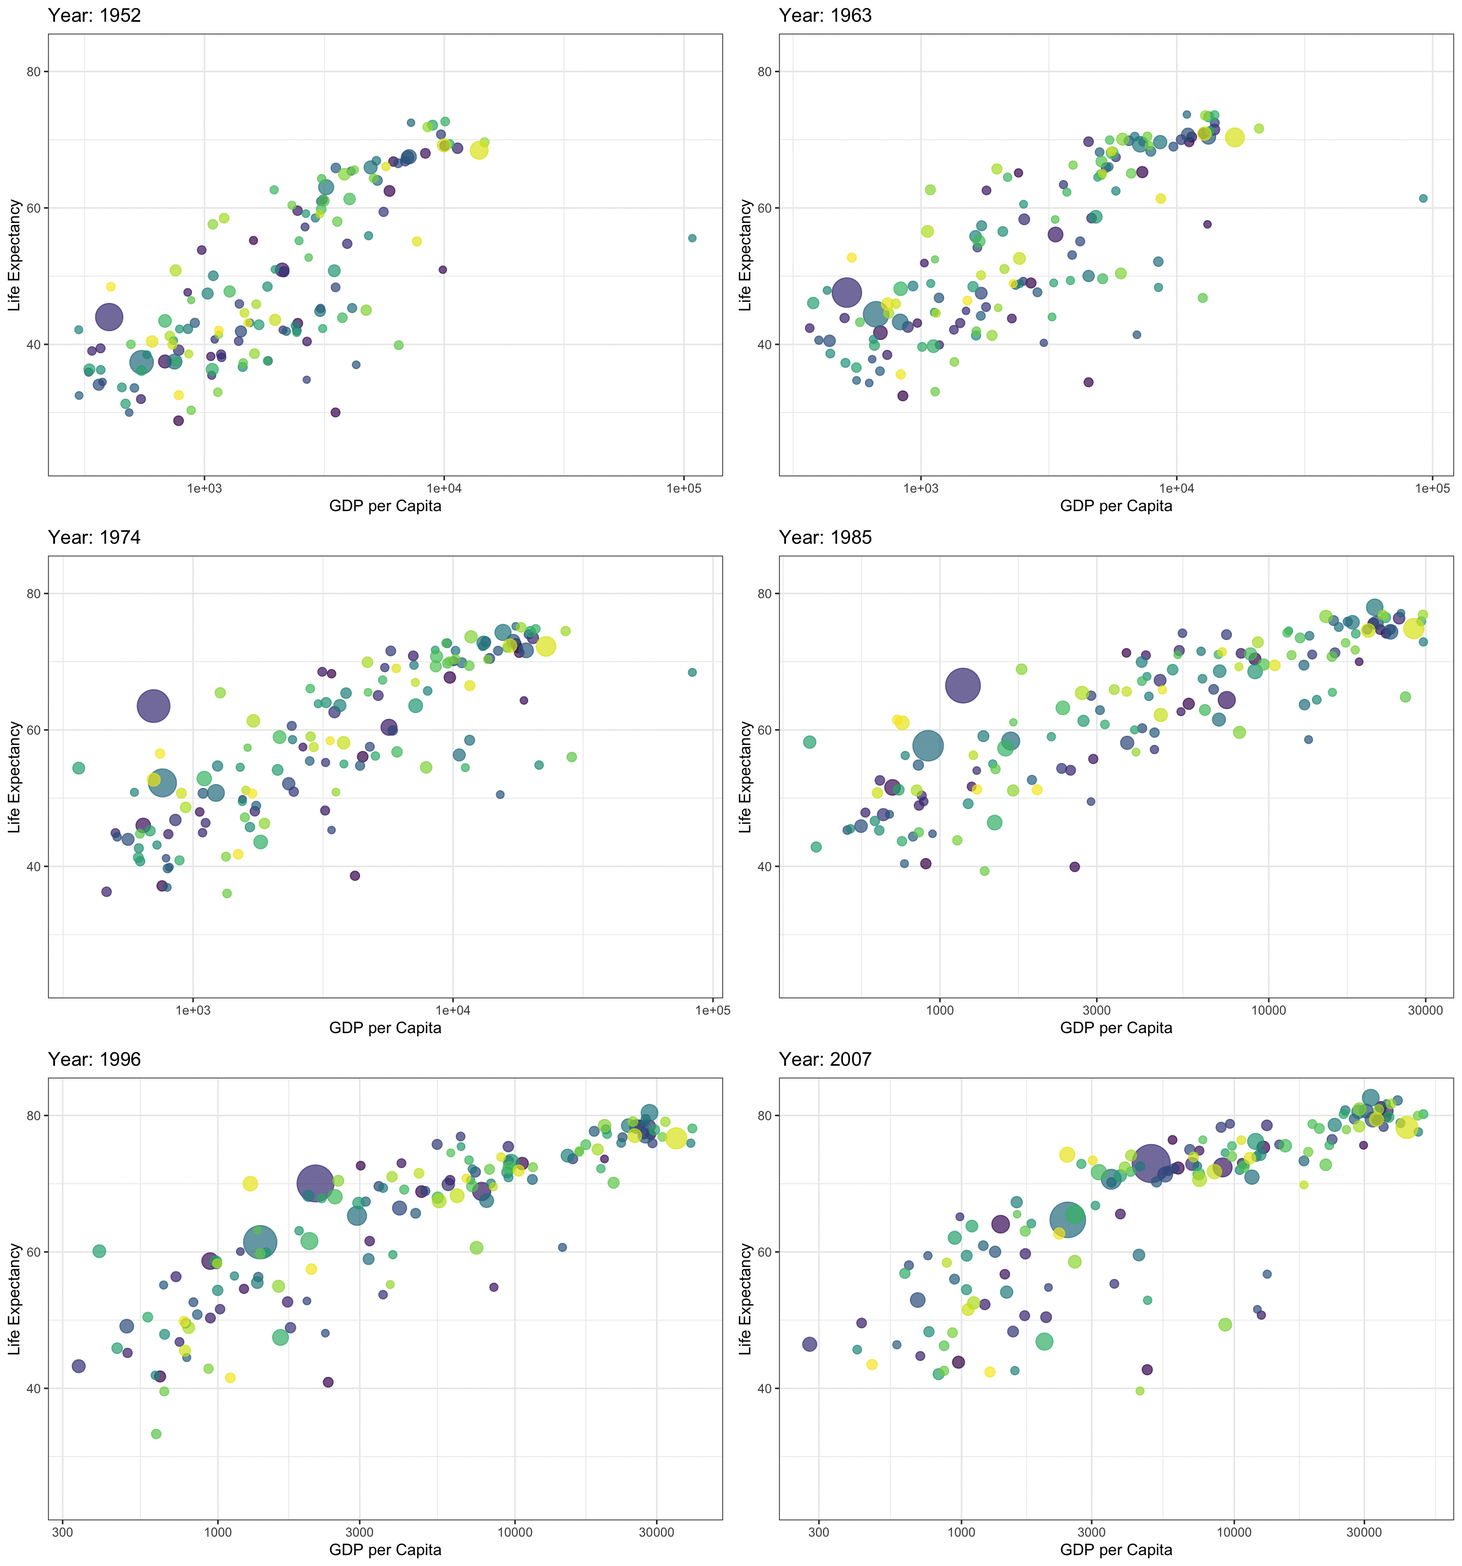
Here is a replication of the data animation of the data set, “Gap Minder”!
# Setting up the new R environment, starting fresh, click run!
(list=ls())
── Attaching packages ─────────────────────────────────────── tidyverse 1.3.2 ──
✓ ggplot2 3.3.6     ✓ purrr   0.3.4
✓ tibble  3.1.6     ✓ dplyr   1.0.8
✓ tidyr   1.2.0     ✓ stringr 1.4.0
✓ readr   2.1.1     ✓ forcats 0.5.1
── Conflicts ────────────────────────────────────────── tidyverse_conflicts() ──
x dplyr::filter() masks stats::filter()
x dplyr::lag()    masks stats::lag()
library(gapminder)
library(gganimate)
theme_set(theme_bw())
head(gapminder)
# A tibble: 6 × 6
  country     continent  year lifeExp      pop gdpPercap
  <fct>       <fct>     <int>   <dbl>    <int>     <dbl>
1 Afghanistan Asia       1952    28.8  8425333      779.
2 Afghanistan Asia       1957    30.3  9240934      821.
3 Afghanistan Asia       1962    32.0 10267083      853.
4 Afghanistan Asia       1967    34.0 11537966      836.
5 Afghanistan Asia       1972    36.1 13079460      740.
6 Afghanistan Asia       1977    38.4 14880372      786.
p <- ggplot(
  gapminder,
  aes(x = gdpPercap, y=lifeExp, size = pop, colour = country)
) +
  geom_point(show.legend = FALSE, alpha = 0.7) +
  scale_color_viridis_d() +
  scale_size(range = c(2, 12)) +
  scale_x_log10() +
  labs(x = "GDP per Capita", y = "Life Expectancy", title = "")
p
p + transition_time(year) +
  labs(title = "Year: {frame_time}") +
  view_follow(fixed_y = TRUE)
p2 <- ggplot(gapminder, aes(gdpPercap, lifeExp, size = pop, colour = country)) +
  geom_point(alpha = 0.7, show.legend = FALSE) +
  scale_colour_manual(values = country_colors) +
  scale_size(range = c(2, 12)) +
  scale_x_log10() +
  facet_wrap(~continent, ncol=5) +
  theme( plot.title = element_text(size=20, face= "bold", colour= "black" ),
         axis.title.x = element_text(size=18, face="bold", colour = "black"),
         axis.title.y = element_text(size=18, face="bold", colour = "black"),
         axis.text.x = element_text(size=18, face="bold", colour = "black"),
         axis.text.y = element_text(size=18, face="bold", colour = "black"),
         strip.text.x = element_text(size=16, face="bold", colour = "black"),
         plot.margin = unit(c(0.5, 0.5, 0.5, 0.5), "cm") ) +
  # Animating the plot
  labs(title = 'Year: {frame_time}', x = 'GDP per capita', y = 'Life expectancy') +
  transition_time(year) +
  ease_aes('linear')

animate(p2, width=1600, height=400)


